
In the swiftly moving retail industry, the ability to infer data visually is surely a game-changer. With rising digital interactions and ever-growing customer demands, data visualization has become a must-have service in almost all industry verticals. Data visualization in retail enables businesses to transform raw data into understandable, clear, and actionable steps that drive growth.
Retail industry analytics have helped businesses embrace digitalization to the core. Retailers who leverage retail data visualization opine that they see up to a 35% improvement in decision-making speed and customer engagement. Such a shift is not just reflecting aesthetics but also hyper-personalized experiences through visual clarity.
Let us thoroughly see how data visualization is driving the future of personalized retail experiences.
The Rise of Personalized Retail
As the market gets tougher competition, delivering unique shopping experiences is the backbone of success. Retailers do not prefer a one-size-fits-all solution, but embrace personalized retail experiences to resonate with individuals on a data-driven and deeper level.
What is Personalized Retail?
Personalized retail means customizing every interaction with a customer, right from suggesting items to rewards, based on specific data. Such strategies blend customer behavior analytics with UX design to bring in engagement and boost trustworthiness. Retailers who personalize strategically generally observe double the engagement rates as compared to those who don’t do that.
Customer Expectations in the Digital Age
Modern-day shoppers wish brands would ‘get’ them, and they need experiences that reflect their requirements, behavior, and interests, irrespective of whether they are visiting the store, online, or somewhere in between. Brands that fail to meet such expectations risk losing loyal customers to more responsive and digitalized competitors. That is why improving customer experience with data is not an option, it is the foundation today.
Types of Data used for Personalization in Retail
You need to understand which data inputs matter the most in creating personalized and meaningful retail experiences. Such insights help you uncover the intent and preferences to motivate buyers.
Some of the common data types include –
- Loyalty engagement
- Browsing behavior
- Location pattern
- Social interaction
- In-store analytics through IoT sensors
- Purchase history
When unified, all these data forms the best base for eCommerce personalization analytics and better merchandising.
Also, it is essential to mention that complying with privacy regulations like CCPA and GDPR is essential to use customer data securely and ethically. Such laws give customers the power to control their data, resulting in building better trust and transparency in retail personalization efforts. It is a vital thing for long-term customer faith gain due to the following reasons:
- GDPR emphasizes user consent and the protection of user information
- Compliance reduces the risks of any legal issues, fines, and builds customer trust
- CCPA offers rights to access and delete personal information
Data visualization in Retail
The role of data visualization in business cannot be ignored for any sector. The sheer volume of customer data could be huge, and, therefore, data visualization in retail comes as the best helping hand. It can translate complex databases into digestible visuals that improve clarity and shorten response time. When used strategically, retail data visualization bridges the gap between action and analytics to accelerate smarter decisions that can result in profits.
Data visualization is the practice wherein AI systems convert numbers and patterns into visual formats such as maps, charts, Venn diagrams, and graphs. For retailers, it transforms raw data into insights that are easy to understand and act upon quickly.
Data visualization in retail plays a crucial role in tracing emerging trends, mapping out better promotion campaigns, and unveiling customer drop-off points. Retail analytics dashboards built through strong visuals enable retail analysts to pivot strategies with a better approach.
Types of Data Visualization Tools used in Retail
There are ample top data visualization tools for businesses and retailers that use a diverse array of platforms for key performance metrics visualization. These range from sophisticated third-party platforms to in-built CRM dashboards that offer real-time information syncing and predictive intelligence.
Some tools integrate AI and automate to provide AI-powered retail analytics at scale to help retail teams spot microtrends and inefficiencies in operations instantly.
- Tools such as Power BI and Tableau are quite popular for their real-time dashboards and in-depth analytics that combine both speed and accuracy.
- Data visualization tools in retail often come with drag-and-drop interfaces and user-friendly layouts, along with dynamic filtering to provide clarity even to non-technical retail team members.
How does Retail Data Visualization Enhance Customer Insights?
Understanding customers and their choices is the key to success in the retail industry. Data visualization in retail allows brands to simplify complex numbers into intuitive insights that even non-technical teams. Data visualization can empower retailers to build strategies not based on assumptions, but on real behavior.
Retail businesses can use retail data visualization tools to identify what drives their sales and what deters them by connecting the dots across touchpoints. They can use the visualized insights to focus their attention on bringing the best sales.
Real-Time Data Tracking and Visualization
Retailers today must catch the latest trends and respond to them as they happen or ASAP. With real-time retail analytics dashboards, businesses can monitor key indicators and make quicker decisions in minutes. This sort of live visibility makes it possible to immediately change campaign and stock optimization to reduce waste and enhance agility.
Understanding Customer Behavior and Preferences
One of the core benefits of data visualization is to enhance customer experience. Customer behavior analytics in retail helps businesses decode the psychology behind each trade or transaction. When data visualization in retail helps clarify the picture, the patterns start telling compelling stories about what customers need, what and when they want it, and why they choose certain products over others.
With visual analytics in retail, even non-technical sales teams can easily identify what is working and what is not, ensuring quicker execution and improvement.
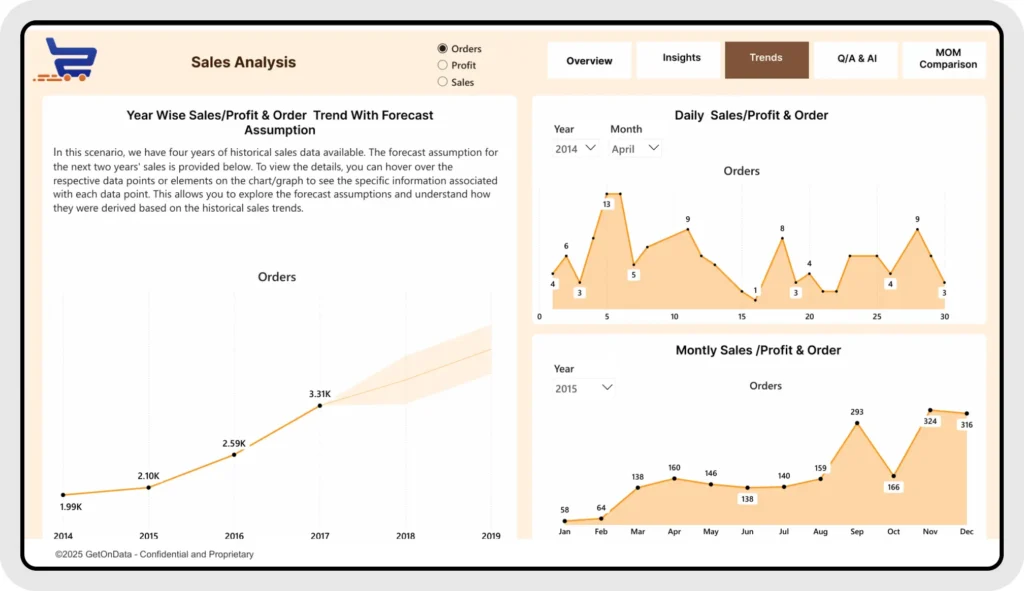
Predictive Analytics and its Impact on Retail Strategies
When visualized clearly, predictive analytics can reveal what is likely to occur in the next few days. This gives retailers the power to proactively act rather than react. Such a forward-thinking approach can transform strategic planning into the best competitive edge. Brands that use this method can gauge a more accurate forecast with more personalized promotions. This is a smarter inventory management, guided by a visual story.
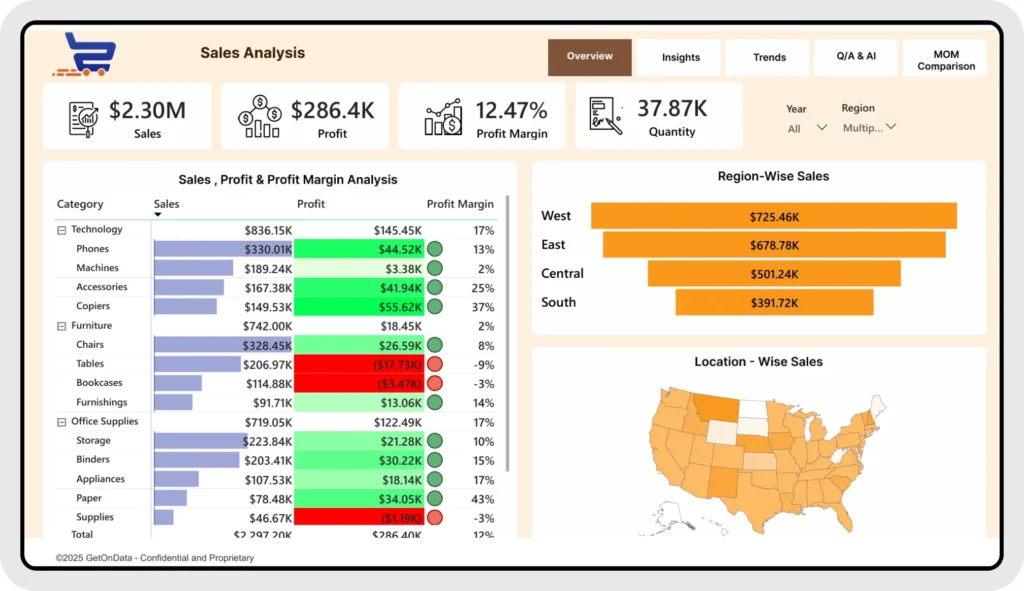
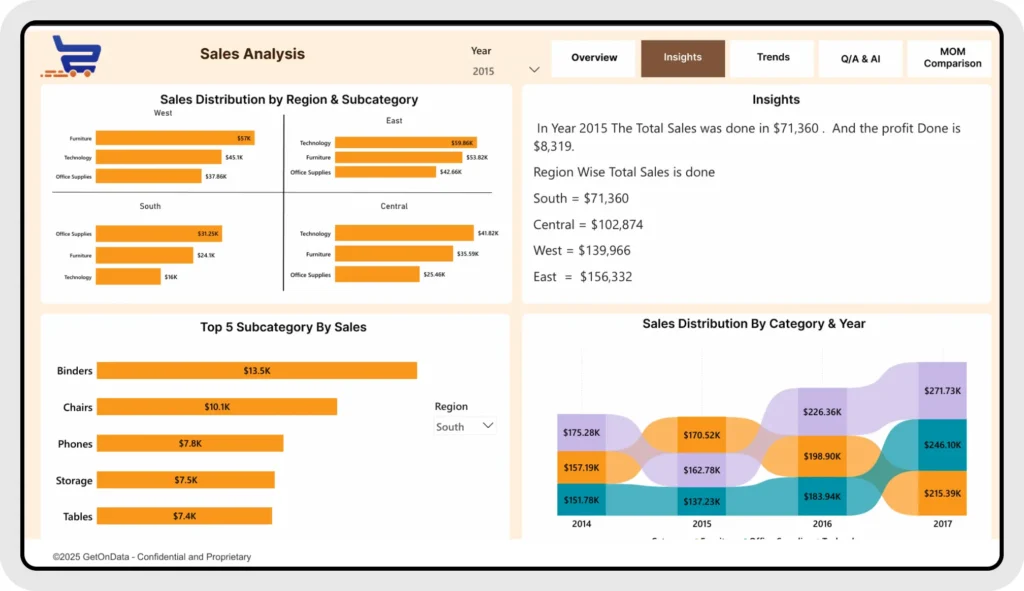
The Power of a Visual Dashboard in Decision Making
Visual dashboards in retail are the nerve centers of modern-day retail decision-making. They consolidate multichannel data into clear and understandable views to help sales leaders stay aligned and informed about what’s going on. Smart dashboards in retail improve cross-functional collaborations and speed up the response times by presenting real-time insights in a simple format.
Personalizing Customer Experience with Data Visualization
Retail personalization with data goes way beyond just a customer’s name and address. Through advanced visualization techniques, retail businesses see their entire journey and optimize every moment to ensure loyalty, satisfaction, and a relevant pitch. When tied into marketing campaigns, touchpoint analysis, and product suggestions, visual data in retail becomes a powerful tool to personalize things. Here are a few factors worth noting:
Customized Marketing Campaign Through Data Visualization
Visualized data empowers marketers to build campaigns to connect to the right customer and deliver them a perfect message at the ideal time. Companies can remarkably enhance their ROI and bring customer retention through an intuition-based approach to an evidence-driven approach. It can help businesses not only to amend their strategies but also to stay competitive.
- Enhanced ROI: optimizing campaign performance for better returns
- Targeted Messaging: identifying and communicating with particular audience segments
- Improved Customer Retention: strengthen connections with the existing customers
- Informed Decision-Making: using data insights to unveil newer opportunities
Dynamic Product Recommendations Based on Visual Insights
Product recommendation engines perform better when they are guided by clear and statistical visuals. Retail teams can improve their algorithms by visually tracking customer engagement and conversion traces to offer hyper-personalized recommendations that align with a specific customer’s preferences. A refined approach to such an extent can address customer needs faster, and it results in deeper trust in the brand. Here is how:
- Enhanced Algorithms: Refined recommendation models that use visual data to better predict customer behavior.
- Enhanced Trust: Credibility built by offering a pitch-perfect recommendation that feels considerate and personalized.
- Actionable Insights: Key trends are uncovered through visual analytics
- Increased Conversions: Tailored suggestions are delivered for high purchase rates
Visualizing the Customer Journey for Tailored Experiences
Any retail company must map the customer journey. However, doing it with visualization makes it accessible to everyone on the board. The journey maps can pinpoint gray areas and missed opportunities while identifying emotional highs with clear contexts. One has to understand each step through visualization so as to offer personal experiences at scale with better consistency.
Benefits of Data Visualization for Retailers
Data visualization in retail transcends mere aesthetics. It revolutionizes the way retail businesses engage with customers, strategize their marketing campaigns, and operate overall. Retailers can get a powerful tool by making complex data visually intuitive to drive better operations and sharper decision-making. These tailored experiences can also ensure customer loyalty. Here are some key advantages of data visualization in retail:
- Strategic Clarity: Simplifying intricate data can uncover actionable insights. You get better market positioning.
- Rapid Adaptability: Responding to market shifts and trends quickly is possible through visual tracking of data changes.
- Improved Operational Efficiency: Identifying bottlenecks and optimizing workflows through visual analytics is possible.
- Personalized Customer Experience: Leveraging data to build individualized shopping journeys resonating with customer preferences.
- Data Democratization: Making insights accessible throughout the ecosystem in the organization to ensure collaboration and strategic decision making.
Real-World Examples of Data Visualization in Retail
A number of brands are already leading the way in retail data visualization, and their success stories teach valuable lessons. Real-world applications show how visuals can unveil insights and improve targeting while creating a better in-store and online experience. These examples showcase that the role of data visualization in retail success cannot be ignored, especially when blended with predictive analytics and hyper-personalization.
Case study 1: Optimizing Retail Performance with Looker for a Major US Retailer
A fast-growing retail chain in the US required an advanced analytics framework to meet the customer and market demands in their competitive field. While the existing system lacked real-time insights and predictive analytics, a Looker dashboard for retail solved all its problems with automated cost per unit calculation and actual vs. projected values for each variable.
As a result, the company witnessed a 60% reduction in runtime as it transitioned from manual data loading in Excel to an automated process in Looker. Users could quickly and easily comprehend data trends by having several graphs and charts in a single window.
Case study 2: Advanced Data Dashboard for Retail Business Decision-Making
An integrated dashboard was built to simplify the difficulties faced by an American business that wanted to simplify its complex data. They needed to manage and interpret around 500 to 3500 terabytes of data per second. Data accuracy and consistency were the challenges, and diverse reporting was needed.
The solution was carried out with an advanced data dashboard for the smooth flow of information by utilizing platforms like Snowflake. Tools like Tableau can produce deep data analytics to uncover hidden patterns and trends.
The result was stunning – 70% improvement was noticed in marketing efficiency, 60% reduction was identified in data analysis and reporting. The company also observed a 50% revenue increase through an omnipotent dashboard.
The Technology Behind Data Visualization in Retail
Behind every visual insight lies the best technology stack. modern retail data visualization tools rely on Artificial Intelligence, IoT, Machine Learning, and cloud computing to offer real-time and scalable information that is intelligent and dependable. Retailers can embrace these technologies to automate their data collection and learn omnichannel behaviors while visually presenting them in a way that enables sales teams to be more efficient.
- Machine Learning and AI in Data Visualization: Through AI-powered retail analytics, businesses anticipate purchase behavior and personalize outreach with the best accuracy.
- Integration of IoT and Data Visualization: IoT devices have sensors that can track everything from footfalls to product interaction and customer journey. It can be visualized on a dashboard to build actionable retail customer insight in real-time.
- Cloud Computing and Data Accessibility: Cloud-based platforms allow data from myriad retail systems and sync seamlessly. This can make sure that real-time visual retail analytics are available for all team members from anywhere.
Challenges and Considerations
While there are many benefits of adopting data visualization in retail, they also come with challenges. Some of the challenges are noteworthy, and you must address them:
- Data privacy
- Data accuracy
- AI algorithm bias
- Partial Machine Learning training
- Data complexity
- Successful adoption
- Technological capability of the organization
- Organizational readiness for a truly data-driven culture
- Assurance of data accuracy and integrity
Data Visualization Trends in Retail for 2025 and Beyond
As technology evolves, data visualization for retail marketers is getting faster, smarter, and more immersive. The future of retail will be better hyper-personalization and an omnichannel approach with intelligence and accuracy. The future also holds in increased intuitive visual platforms and unparalleled UI/UX design.
New tools will democratize data access, and they will empower not just human analysts but also marketing and sales executives, along with customer service executives, to make data decisions quickly and efficiently.
- Hyper-customization powered by AI will deliver suggestions and offers based on real-time intent and context.
- AR/VR visualization will transform and simulate the customer journey to enhance merchandise decisions.
Ready for Data Visualization to Boost your Retail Business?
As customer expectations and market trends grow unpredictably, there is a grave need for smarter and clearer tools. Data visualization in retail is not just a trend; but it has served as a foundation of future-ready and customer-focused retail strategies and campaigns.
Retailers who embrace retail data visualization will meet the demands of all kinds and also exceed them. This will also offer them personalized and intuitive insights that are deeply data-driven.

