
We live in an era where it is essential for us to be backed by necessary data to encourage our potential in the market. Today’s robust digital economy is also influencing modern businesses to be flooded with data, starting from customer behaviour, performance metrics, and reliable market trends. However, data can’t be impactful enough if you can’t discover its underlying meaning.
It has to be properly analysed and transformed into meaningful insights. This is where the necessity of Business Intelligence comes into the scenario. As per the current statistics, around 70% of organizations are relying upon real-time analytics for advanced decision-making.
With the trending aspects of BI, the market has been promoting a series of tools. However, Power BI and Tableau are effectively at the top rank. Both of these tools are known for their comprehensive visualization capabilities and in-depth analytical functions.
As Power BI is incorporated by Microsoft, it effectively showcases a similar ecosystem and can help your company to leverage seamless connectivity with Teams, Excel, and Azure. It also demands that companies hold the scalable solutions of Power BI database consulting services.
Tableau, on the other hand, is an essential part of Salesforce and is famous for its visualization abilities. It can simplify your data in a storytelling format for better understanding. Moreover, it is extremely fascinating for data professionals who want their insights to be customized and flexible.
With this blog, as a business leader, data analyst, or decision-maker, you can understand the essential factors that differentiate Power BI and Tableau.
Overview of Power BI and Tableau
Here, you can go through the detailed overview of what is Power BI vs. Tableau and how they can help your company, backed by the necessary insights about the customer base.
What is Power BI?
❖This eminent tool was initiated by Microsoft to help businesses with powerful data analytics. As this tool adopts the convenience of the Microsoft ecosystem, it boasts reliable security and enterprise-level support with a great reputation in the market. You can leverage the help of this tool with the prominent assistance of BI consulting companies, as they can guide you about the recent updates in the tool. With necessary updates, this tool is seamlessly aligning with multiple platforms.
❖One such behaviour that every user adores about Power BI is its compatibility with other Microsoft tools. It can work effortlessly over platforms like Excel, Azure, and Office 365. In Excel, you can easily import your spreadsheets and use similar formulas to DAX. Power BI consulting companies can help you connect the following tools with Azure Synapse Analytics, SQL Database, etc.
❖Power BI comes with both cloud-based and on-premise deployment features. Cloud-based, the respective tool allows you to generate and share the dashboards in real-time from any place. When it comes to the On-premise option, your organization can utilize Power BI Report Server for effective data control.
What is Tableau?
❖The following tool comes under Salesforce and has gained fame for offering customer-oriented data strategies. Tableau now holds the power of Salesforce’s ecosystem and advanced AI elements. This enables intelligent analytics and is extremely suitable for your CRM and marketing trends.
❖Tableau’s major potential is in its data visualization abilities. However, you need the guidance of professional Tableau data visualization consulting services to acquire this data more effectively. As most of the tools prioritize data modelling and backend processes, Tableau proceeds with a visual storytelling narrative.
❖The dashboards of Tableau are extremely interactive and adaptable. As a user, you can easily filter the necessary data on time. With the usage of drag-and-drop features, you can initiate creative dashboards without any coding. To initiate all these flexible approaches, you need to abide by the proficiency of professional Tableau analytics consulting services.

User Interface and Ease of Use
When you select a BI tool, it is necessary to verify the effectiveness of the user interface. It is critical for organizations that consist of teams ranging from beginners to professional analysts.
Power BI
❖Excel users can easily understand the working protocols of Power BI. So, you may expect similar interface features like ribbon menu, functions, and layout. So, if your team is already familiar with Excel and is comfortable working on it, Power BI can be convenient for them. The Excel formulas, charts, and tables will be functioning more smoothly than the Power BI. So, if your company relies on Excel to influence the workflow, this option is viable for you.
❖With the inclusion of a seamless interface, the users can integrate any type of dashboards without the use of any complex coding. You can easily rearrange, place, or resize the visual elements like graphs, tables, charts, and slicers. With the help of professional BI consulting companies, you can encourage more visual simplicity with quick report creation.
❖To further encourage the user experience, Power BI comes with a series of pre-built templates and dashboards. These templates can easily cover your day-to-day or common business requirements. Your team can easily overview customer feedback, sales performance, and financial reports. You can also take the help of BI visualization consulting services to understand how to customize the templates and align them with your KPIs and banding values.
Tableau
❉Tableau flaunts its visual-first approach that incorporates storytelling through data. The following interface promotes real-time visualization that converts when your user selects any data points or uses any filters. Users with potential experience can utilize this feature to get acquainted with complicated data.
❉With other advanced mechanisms, this platform delivers intuitive dashboard creation tools. The following platform comprises a drag-and-drop control with eminent customization. So, with the help of an expert Tableau consulting company, you can easily control the formatting, interactivity, and data actions authentically.
❉As compared to Power BI, Tableau has a better learning curve. This essential feature is very useful for users who are beginning their careers in data analytics. You may need hands-on practice and proper training to understand the filters, data structure, and table calculations of Tableau. With detailed learning, it will be easy for you to handle complicated data with ease and get detailed insights about it.
Also read :- Power BI Tips for CEOs – Custom Dashboards That Matter
Data Connectivity and Integration
The BI tools should effectively showcase compatibility with multiple data sources and workflows. Both of these tools have their potential to showcase.
Power BI
❖As we have discussed earlier, Power BI is constructed to work effortlessly across the Microsoft ecosystem. This feature makes it an incredible preference for organizations that are well-acquainted with Microsoft tools like Teams, Office 365, etc. Your reports can be integrated into SharePoint and can be accessed securely through your Microsoft accounts. This ensures consistent and easy usage over multiple platforms.
❖It offers native connectors that enable it to effectively drag data from SharePoint lists, Excel workbooks, Azure Services, and On-premise SQL Server databases. To incorporate this, you can adopt the help of BI visualization consulting services, which can help you enable real-time data sync.
❖Power BI incorporates a series of APIs and connectors for your third-party applications, such as Google Analytics, Salesforce, Mailchimp, etc. Through this, you can get integration facilities and users can easily utilize it without any risks.
Tableau
❉This tool has already gained fame for supporting a wide range of data sources. So, if your organization has a diverse tech stack, this tool can be convenient for you. You can easily connect to local files or any enterprise-level systems without the necessity of extra plugins. Most of the Tableau consulting firms also consider this to be an efficient feature.
❉Tableau also serves compatibility with a series of data sources, and among them, the major ones are cloud databases, big data platforms, and Google Sheets. This is one such extensive support of the tool that drew the attention of many organizations. Moreover, this can be a flexible choice for Tableau data visualization consulting engagements while dealing with structured or unstructured data.
❉Tableau delivers live connections as well as extract-based connections to match your multiple performance and usage requirements. With live connections, you can be assured of current data visibility. On the other hand, extracts can improve your performance by allowing offline analysis.
Data Preparation and Modeling
Before you incorporate any dashboards or visualizations, you must clean, shape, and modify the raw data. Both tools are eminent in these activities.
Power BI
❖One such significant feature that Power BI holds is a built-in Power Query Editor. This element can easily simplify the data along with proper transformation. Because of its intuitiveness, you can easily remove duplicates, merge tables, upgrade data, or shift the interface without any code writing. Each of your steps will be recorded as a query and can be reused later.
❖Power BI can handle from basic to intermediate levels of data modelling. You can effectively point out relationships between the tables with the use of drag-and-drop features. You can also manage calculated columns or manage data in a streamlined manner with the assistance of a Power BI data visualization consultant. The modelling interface of the tool is beneficial for analysts who want to structure data efficiently without any technical expertise.
❖For more effective modelling, Power BI makes the use of DAX, which is a powerful formula language that is the same as Excel functions. With this, you can incorporate time-based calculations, calculate measurable KPIs, and understand the conditional logic precisely.
Tableau
❉This tool comes with another efficient feature known as Tableau Prep. This is designed effectively for data transformation, cleaning, and precise modelling. It comes with a flow-based interface through which you can get connected to multiple data sources. It can also clean the inconsistencies and generate repeatable prep workflows.
❉Most of the users consider Tableau Prep to be more viable for visual data preparation. A professional Tableau Implementation Company can easily see how a significant shift in the data is affecting the overall pipeline. With this real-time feedback, you can understand the data better and can accordingly shape your decisions.
❉When it comes to the advanced transformations, the workflow of Tableau can be complicated. Tableau may require external tools and workarounds for complicated logic. So, if you want to access deep data modelling, this platform can be a bit challenging for non-technical users without valuable training sessions.
Visualization Capabilities
One of the major terms that differentiate these tools is their way of visualizing and interpreting data. Both of these tools consist of effective tools but differ in aesthetic, flexibility, and many functions that we will review here.
Power BI
❖Power BI is famous for holding the eminence of pre-built visuals. This includes pie charts, bar charts, maps, gauges, line graphs, and much more. Users can utilize them anytime and can customize them as per their requirements. For more robust requirements, the tool also leverages the custom visuals marketplace, where you can download the visuals developed by the community and Microsoft.
❖This tool showcases an extreme range of operational reporting and KPI dashboards. Through this, you can track metrics such as customer service levels, sales performance, and much more in real-time. The following dashboards are very functional and are good for day-to-day tracking. Many BI companies in India consider these approaches to be critical.
❖Power BI remains a bit less flexible than the visualization capabilities of Tableau, specifically for aesthetic customization. Many Power BI consulting firms also adopt the commendable abilities of Tableau and combine them with the robust functionalities of Power BI.
Tableau
❉Tableau is generally considered the top choice in the industry for proficient data visualization abilities. It can easily produce aesthetic and quality visuals for your organization that are visually pleasing and functional at the same time. You can generate charts that respond in a diverse manner to multiple filters.
❉It incorporates a drag-and-drop experience that allows users to just pick data fields and place them on a canvas. This way, you can design complicated and layered visuals easily. You can access the help of Tableau analytics consulting services to understand the following platform’s advanced formatting, animations, and conditional coloring.
❉Because of the excellent data storytelling and exploration features of Tableau, it comes with a flexible interface that can empower you to follow the data trails and discover insights through guided instructions. Through this, you can also generate comprehensive reports that are seamless for technical as well as non-technical users.
Performance and Scalability
With your business growth, you might encounter the demand for larger data volumes and shifting user requirements. So, a BI tool must evolve to meet these requirements. Let us understand the scalable factors of Power BI vs. Tableau.
Power BI
❖Power BI showcases extensive performance within the Microsoft ecosystem. You can easily integrate it with eminent tools like Excel and much more. So, if you are aware of the Microsoft ecosystem, using this tool will be easy for you. Organizations already invested in the Microsoft suite can also unveil potential features that beginners might not know.
❖It is evident that Power BI has many strong capabilities. But it might face performance challenges while dealing with large and voluminous datasets along with complicated models. As your data size and complexity escalate, the tool might slow down the processing of queries and report rendering.
❖The performance values of Power BI effectively increase when combined with Azure services like Azure Synapse Analytics. The following cloud tools can enhance your data storage capabilities by accessing Power BI to upgrade effectively and manage the complex tasks.
Tableau
❉When it comes to a detailed Power BI vs. Tableau comparison, Tableau is curated to visualize a large amount of data without any vast performance challenges. No matter if you are valuing live connections or in-memory extracts, this tool offers efficiency, making it a suitable choice for organizations with growing datasets.
❉The engine of Tableau is already built to maintain complicated logic and calculations. It can also blend your data with minimal latency and risks. Most of the time, it has defeated Power BI in features like layered filters, advanced analytics, and visualization. It can offer a smooth user experience during any type of intricate analysis.
❉When you deploy the tool through Tableau Server, it delivers maximum scalability and performance. Some of the eminent features that can draw your attention include distributed architecture, user support, load balancing, etc. Through this, you can be assured that the enterprise-level deployments are quick and efficient under pressure as well.
Pricing and Licensing
In this section, let us review the pricing and licensing protocols involved in these two tools, and which platform wins the trend.
Power BI
❖As a user, you will be glad to know that Power BI comes with a free version known as Power BI Desktop. This can be effective for your company if your team is beginning to explore data visualization. The following version comes with a series of features that can help you create dashboards and reports. Small-scale or start-up businesses can benefit from this without any financial investment burden. So, when it comes to the pricing, Power BI wins the trend in Microsoft Power BI vs. Tableau.
❖For extensive team collaboration or any enterprise features, Microsoft leverages paid versions of Power BI in the form of Pro and Premium. The Power BI Pro is efficient for individual users who need to share content throughout the organization. On the other hand, Premium offers more enhanced performance and access features like AI. The Premium one also offers a per-capacity pricing model for enterprise-scale deployment.
❖As compared to Tableau, the pricing structure of BI is affordable for mid-sized businesses. Even the pro licensing also remains low per month. So, if your company is more into budget conscious options, this framework can be essential and can grow with your company.
Tableau
❉If we compare the cost of Power BI vs. Tableau, this platform can be a bit pricy. The features might be robust for many users who handle complex analytics, but the initial investment can hamper your financial operations.
❉Tableau offers tiered pricing features based on the roles of the users. Tableau delivers better pricing options as per the roles of your team members. So, you can review the dashboards and explore the visualization features for better effects. This way, you can control the costs by providing the licenses as per the actual requirements.
❉If you demand large-scale deployments, Tableau can leverage effective enterprise plans that involve Tableau Cloud and Tableau Server. Moreover, you can get the services with secure features. So, if your organization demands robust infrastructure, these plans can be suitable for you. So, in the Power BI vs. Tableau features, Tableau grasps the superiority.
Security and Compliance
Let us review the security standards and compliance features of Power BI and Tableau.
Power BI
❖Power BI is effectively integrated with the security ecosystem of Microsoft. This includes Azure Active Directory. With this, your organization can manage user identities and can access seamlessly with the usage of existing Microsoft credentials.
❖With the effective value of role-based access, Power BI secures the data authentically. As per your wish and requirements, you can assign access levels to your team members according to their roles. Power BI consulting firms mostly offer this feature to assist businesses in integrating secure data practices.
❖This platform is compliant with eminent global regulations to prevent any kind of penalties. The following certifications are important for organizations in finance, healthcare, and other eminent sectors.
Tableau
❉With Tableau, you can get authentic user permission settings and easily apply encryption. Through this, your business data will remain protected, and no unauthorized access can breach your insights.
❉With the inclusion of Tableau Server, organizations can curate security policies as per their business’s internal requirements. With the help of a genuine Tableau consulting company, you can implement such settings that align with your enterprise policies.
❉Tableau effectively aligns with the necessary security standards, like GDPR, and much more. So, you can prefer this platform to handle international data without any risks of breaches.
Also read :-Tableau Best Practices Your Consulting Partner Should Be Following
Community and Support
Let us discover the community and support of these two platforms in a detailed way.
Power BI
❖This platform has a vast and rapidly growing community. So, you can easily find help for the challenges and attend tutorials to get solutions. You can even take part in peer discussions for better performance.
❖It offers structured learning with access to Microsoft Learn. Here, beginners and advanced users can get answers to all their queries and can gain knowledge from certified experts.
❖Power BI always abides by regular security updates. This ensures the platform is scaling up as per the trending requirements of the businesses.
Tableau
❉This platform has a dedicated user community, and they actively share ideas and innovations for development. The following community drives for better knowledge and flaunts great collaboration strategies.
❉Tableau Public offers you the chance to effectively visualize the data and customize it. It can inspire you to learn and adopt new features for better data analysis.
❉This platform hosts an annual conference that features networking, hands-on sessions, and presentations for a better understanding of the tool.
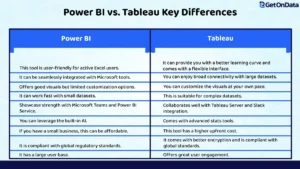
Power BI vs. Tableau: Features Comparison Summary Table
In this section, let us briefly summarise the Power BI vs. Tableau feature comparison.
Which Tool is Right for You?
Now, you might be clear about the Power BI vs. Tableau difference. Let us understand which tool can be the right pick for you.
Choose Power BI If:
❖You are a Microsoft-centric organization: Your team members are already aware of using Microsoft tools like Azure and Excel. Power BI integrates with these tools effortlessly without any challenges.
❖You need an affordable and scalable solution: Power BI flexes low investment charges with flexible licensing options. So, this is valuable for low or mid-level businesses.
❖You prefer Excel-like functionality: The interface of Power BI remains easy for Excel users as it comes with drag-and-drop features.
Choose Tableau If:
❉You need advanced data visualizations: If your organization is demanding your dashboards to be interactive enough, Tableau can be a good option for your team.
❉Your team is analytics savvy: If your team understands how large datasets work and can customize them properly, this platform is useful for your organization.
❉You require extensive data source support: This tool can be a great support for multiple data sources. So, organizations dealing with complex data can go for this platform.

Power BI vs. Tableau: Contact Us Now to Find the Best Fit for Your Team
It is very critical for you to prefer Power BI or Tableau as per your team’s technical knowledge, long-term business goals, and budget. Both platforms are highly efficient and come with multiple features that can transform your organization’s data visualization process.
Instead of being a part of the trend, focus on your business’s major objective and how you want to rule it. Also, verify if your team is acquainted with the tool and the decision is boosting your business strategies.
To abide by the right decision, make sure to hire a Tableau or Power BI consulting company. They can help you pick the right tool as per your business objectives. So, are you willing to strengthen your BI capabilities? Find a solution that can upgrade your whole team.

