
AI is transforming Power BI by allowing firms to measure data quickly, identify patterns, and make informed decisions. A report by Microsoft said that GenAI adoption reached 16.3% of the worldwide population in mid-2025. Power BI experts can leverage Power BI by integrating advanced analytics, ML, and GenAI to change the way analysts work with business data. It supports businesses for faster data execution, automated metrics, ease of report development, and natural-language interactions.
Understanding Power BI AI features is necessary for data analysts who want to work efficiently with the rising volume of data. By limiting repetitive tasks and highlighting relevant metrics, AI supports analysts to increase reporting accuracy and support better decision-making.
What Are Power BI AI Features?
AI-powered tools that allow analysts to go beyond traditional dashboards are known as Power BI AI features. They enable natural-language communication with business data and quicker data exploration, pattern recognition, and automated analysis. Additionally, these features make it easier to summarize reports and help in finding diagnostic and predictive insights. The Power BI consultancy experts can more effectively review complicated datasets, identify significant trends, and transform data into useful business insights by combining AI with Power BI’s analytical capabilities.

Why Should Data Analysts Use AI Features in Power BI?
Data analysts can reduce repetitive analytical tasks and find trends and patterns more quickly. It identifies insights that might be challenging to find manually, streamlines reports for business users, and speeds up dashboard and report development. Additionally, it supports better data-driven decisions with the help of Power BI AI. Power BI consulting company spends more time interpreting results, investigating opportunities, and providing insightful business recommendations.
How Does AI Work in Power BI?
Power BI’s AI recognizes patterns and trends, comprehends natural language queries, simplifies analysis using Copilot, and interprets data using semantic models. These features allow Power BI experts to explore business data, find important drivers, identify anomalies, and produce insights more quickly. Power BI specialists assist analysts in finding relevant information and transforming complicated datasets into useful insights. These metrics are helpful for decision-making by integrating AI-powered analysis with structured data and business context.
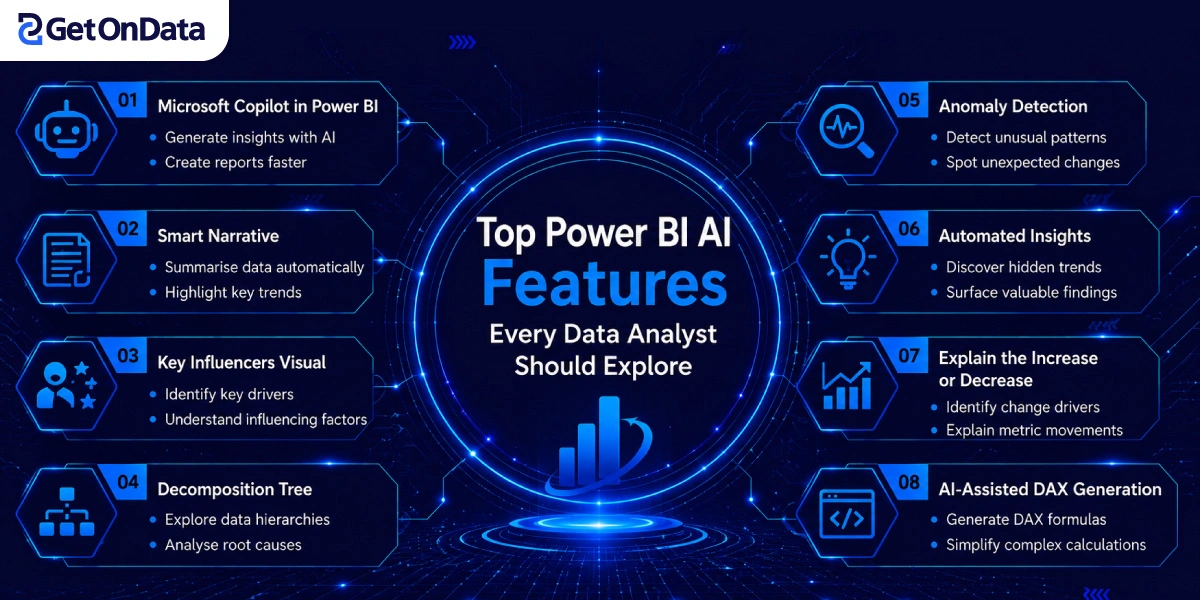
Top Power BI AI Features Every Data Analyst Should Explore
1. Microsoft Copilot in Power BI
Microsoft Copilot in Power BI facilitates the use of natural language in reports, models, and insights by data analysts. Conversational prompts allow users to ask questions, create summaries, and explore business information without having to manually navigate complex datasets. In order to cut down on time spent on repetitive tasks, Copilot can also help with report page creation and analytical result explanation.
Power BI agency enables quicker report development and increases accessibility to data exploration for analysts. When working with large semantic models, where it can be difficult to find relevant data manually, it is especially helpful. Copilot helps analysts concentrate less on routine report-building tasks and more on results interpretation. It blends natural-language interaction with Power BI’s analytical capabilities. Additionally, having well-defined business metrics and organized data models is essential.
2. Smart Narrative
Written summaries of the data displayed in Power BI reports and graphics are automatically produced by Smart Narrative. Without having to manually record every observation, it assists analysts in converting charts and numerical results into understandable explanations. The feature can make reports easier for business users to understand by highlighting changes, trends, comparisons, and significant values.
When developing dashboards for stakeholders who might prefer clear explanations in addition to visual data, analysts can use Smart Narrative. Additionally, it can shorten the time needed to create management summaries and recurring reports. Smart Narrative offers an outline that analysts can examine and improve, rather than taking the place of analytical judgment. Because of this, it is helpful for effectively sharing insights across departments. The feature can help decision-makers who may lack advanced data analysis skills understand complex analytical findings when paired with well-designed visuals.
3. Key Influencers Visual
Power BI specialists can find elements that might be connected to a specific result or metric by using the Key Influencers visual. An analyst might use it, for instance, to look into the variables that affect product returns, sales performance, and customer satisfaction. After assessing the chosen metric, Power BI displays the variables. These results can be used by analysts to investigate patterns that might not be immediately apparent in conventional charts.
Because it offers an organized method for examining possible factors influencing business outcomes, the visual is particularly helpful during exploratory analysis. Teams can produce more trustworthy conclusions and identify areas that require more research by combining Key Influencers with domain expertise, extra analysis, and suitable data validation.
4. Decomposition Tree
Analysts from a Power BI consulting firm can examine the factors that contribute to a specific outcome by breaking down a measure across several dimensions using the Decomposition Tree. An analyst looking at declining revenue, for instance, can investigate the outcome by region, product category, customer segment, or sales channel. Users have the option of manually choosing dimensions or allowing Power BI’s AI to find potentially important splits.
Because of this, visuals help in interactive analysis and root-cause investigation. Analysts can navigate through various data levels within a single visual rather than examining several different charts. When business inquiries necessitate a thorough comprehension of how a metric varies across various categories, the Decomposition Tree is especially helpful.
Also Read: Power BI Implementation Cost in 2026: Complete Pricing Guide
5. Anomaly Detection
Analysts can find unusual shifts or surprising trends in time-series data with the help of anomaly detection. Power BI can highlight values that fluctuate significantly from the expected pattern, saving you the trouble of manually going over each point in a trend. Analysts can use this to look into unforeseen shifts in sales, strange website traffic, sudden spikes in support requests, or other operational variations.
Analysts can look at the surrounding data and look into potential contributing factors when an anomaly is found. The following Power BI generative AI features are particularly helpful for tracking regular business metrics where unusual changes might point to a new problem or opportunity. Results can also be impacted by promotions, market shifts, seasonal effects, or issues with data quality. Therefore, before making judgments or acting, analysts should confirm highlighted anomalies against business context.
6. Automated Insights
Without having to manually look at every potential relationship, Automated Insights assists analysts in finding significant patterns in their Power BI data. Power BI can highlight trends, changes, unusual values, and other possibly relevant information based on the data and visuals that are available. This Power BI AI feature allows for faster exploratory analysis, especially when dealing with numerous business metrics or big datasets.
Automated insights can serve as a foundation for more in-depth inquiries and the determination of areas that require more research. The feature is most useful when combined with a well-thought-out semantic model that includes relevant dimensions and trustworthy measurements. Instead of replacing analytical expertise, the capability enables analysts to swiftly identify areas that might need attention.
7. Explain the Increase or Decrease
Analysts can look into why a value changed between two points or periods by using this power BI AI features official. For example, by looking at appropriate data dimensions, the feature may help in determining variables that might account for a reduction in monthly revenue. This offers a useful method to go from simply noticing a trend to investigating its potential causes.
When looking for contributing factors across several categories, it can minimize the amount of manual comparison required. Instead of being conclusive causes, the explanations that follow should be viewed as analytical leads. Before presenting conclusions to stakeholders or using them to support strategic decisions, analysts can verify the results against operational data, past trends, and business expertise.
8. AI-Assisted DAX Generation
DAX used in Power BI models can be created and understood by analysts with the help of AI-assisted DAX generation. Users can describe the calculation they require in natural language and get help creating a DAX expression instead of writing each measure by hand. Analysts learning DAX, working with new computations, or attempting to speed up routine measure development may find this helpful.
AI support can also offer suggestions for how to approach analytical requirements and provide explanations for current expressions. However, since the right expression depends on the data model, relationships, filter context, and business logic, generated DAX should always be examined and tested. Before utilizing the outcome in production reports, analysts should verify it against established values. When used properly, AI support can reduce development time while giving analysts real-world examples to strengthen their DAX skills.
How Power BI AI Features Improve a Data Analyst’s Workflow
◈ Faster Data Exploration
By identifying trends, patterns, anomalies, and significant relationships, this Power BI AI features overview enables analysts to examine big datasets more quickly. Analysts can use AI-assisted capabilities to quickly find relevant insights and concentrate their time on more in-depth analysis rather than manually going over every data point.
◈ Better Root-Cause Analysis
Analysts can examine the causes of shifting business metrics with the help of AI-powered visuals like Decomposition Tree and Key Influencers. Organizations can strategically use these capabilities to identify trends, assess contributing factors, and support better business decisions with Power BI consultancy.
◈ Faster Report Creation
By helping with summaries, graphics, computations, and natural-language queries, AI capabilities can cut down on the amount of time analysts spend creating reports. By automating repetitive tasks, features like Copilot and AI-assisted DAX generation enable analysts to produce valuable reports more quickly while keeping their attention on analysis.
◈ Better Communication of Insights
Through automated summaries, explanations, and natural-language interactions, Power BI AI features facilitate the communication of analytical findings. Analysts can help business stakeholders understand crucial insights and make better decisions by presenting complicated trends and findings in a more understandable manner.
Best Practices for Using Power BI AI Features
• To guarantee that Power BI AI features produce relevant and trustworthy insights, maintain accurate, well-structured data.
• Create a trustworthy semantic model with appropriately defined dimensions, measures, relationships, and tables.
• Establish precise business metrics so AI systems can reliably understand and evaluate critical KPIs.
• Before using AI-generated results for business decisions, compare them to the original data.
• Integrate AI insights with analyst knowledge to give automated results human judgment and business context.
• When utilizing Copilot, provide enough business context to produce more useful and relevant responses.
• Verify the accuracy of calculations, explanations, and insights by comparing AI outputs to report data.
• Manage sensitive data, permissions, access controls, and the responsible use of AI to adhere to governance and security procedures.
Also Read: List of Power BI Analytics Services for Business Intelligence Implementation
Limitations Data Analysts Should Know
• Since automated recommendations might not always accurately reflect the full business context, AI insights need human validation.
• Inconsistent data can deliver unreliable AI-generated insights, which can lower accuracy.
• Since access to specific AI capabilities varies depending on Microsoft and Power BI licensing requirements, Copilot availability may depend on licensing.
• Since finding a correlation between variables does not imply that one factor directly causes another, AI is unable to establish causation.
• Technical limitations exist for AI features because certain features may rely on data models, supported visuals, configurations, and feature availability.

Ready to Make Smarter Decisions with Power BI AI Features?
Power BI Premium AI features can reduce manual efforts and support analysts to explore data, identify patterns, and generate metrics quickly. The Power BI consulting company supports businesses in integrating these features effectively while aligning with business vision. Analysts should combine AI with their expertise for support purposes rather than replacing human intervention. When firms integrate these features thoughtfully, they will receive valuable business insights and stronger reports.

